


Total government expenditure continued to decrease
In 2018, total government expenditure in the European Union (EU) amounted to 46.7% of gross domestic product (GDP). This share has steadily decreased since 2012, when it stood at 49.7% of GDP.
Among the main functions of general government expenditure in the EU, ‘social protection’ is by far the most important, equivalent to 19.2% of GDP in 2018. The next most important areas are ‘health’ (7.0%), ‘general public services’ (6.0%) such as external affairs and public debt transactions, ‘education’ (4.6%) and ‘economic affairs’ (4.4%). The functions ‘public order and safety’ (1.7%), ‘defence’ (1.2%), ‘recreation, culture and religion’ (1.1%), ‘environmental protection’ (0.8%) and ‘housing and community amenities’ (0.6%) have more limited weights.
This information on general government total expenditure by function comes from an online publication issued by Eurostat, the statistical office of the European Union.
Share of social protection expenditure related to old age highest in Greece and Finland and lowest in Ireland
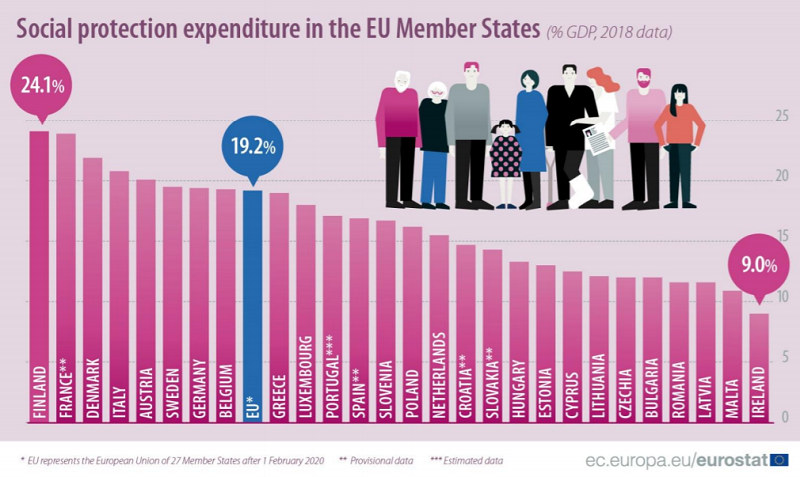
Social protection represented the most important area of general government expenditure in 2018 in all EU Member States. The ratio of government social protection expenditure to GDP varied across EU Member States from less than 10% in Ireland (9.0%) to nearly a quarter in Finland (24.1%) and France (23.9%). Five EU Member States – Finland, France, Denmark, Italy and Austria – devoted at least 20% of GDP to social protection, while Ireland, Malta, Latvia, Romania, Bulgaria and Czechia each spent 12% of GDP or less on social protection.
Social protection expenditure can be further broken down into a number of detailed groups. The group ‘old age’, which includes pensions, accounted for 10.4% of GDP in the EU in 2018. It made up the largest part of social protection expenditure in all EU Member States, with the highest shares being registered in Finland (13.6%), followed by France and Italy (both 13.3%), Greece (13.2%) as well as Austria (12.4%). In contrast, Ireland (3.2%) recorded the lowest share, followed by Cyprus (6.1%), Lithuania (6.2%) and the Netherlands (6.4%).
Government expenditure on health highest in Denmark, on education highest in Sweden
With shares of at least 8% of GDP in 2018, Denmark (8.3%), Austria (8.2%) and France (8.1%) recorded the highest ratios to GDP devoted to health among EU Member States. The highest ratios to GDP of government expenditure on general public services were observed in Greece and Hungary (both 8.3%), Finland (8.0%) and Italy (7.9%). For education, the highest shares were registered in Sweden (6.9%), Denmark (6.4%) as well as Belgium and Estonia (both 6.2%).
The highest share of government expenditure on economic affairs in 2018 was recorded in Cyprus (9.9% of GDP), ahead of Hungary (7.7%), Bulgaria and Croatia (both 6.7%) as well as Belgium (6.6%). For public order & safety, shares were highest in Bulgaria (2.5%), Croatia (2.4%) and Hungary (2.3%). In 2018, at least 2% of GDP was spent on defence in Latvia (2.1%), Estonia and Greece (both 2.0%). The highest shares of government expenditure on recreation, culture & religion were recorded in Hungary (3.2%) and Estonia (2.0%), on environmental protection in the Netherlands (1.4%), Belgium and Greece (both 1.3%), and on housing & community amenities in Croatia (1.7%) and Cyprus (1.5%).
Evolution of general government total expenditure
During the first three years of the economic and financial crisis (2007-2009), government expenditure as a percentage of GDP grew in the EU. It increased from 45.6% of GDP in 2007 to 50.6% in 2009, which was partially due to a lower GDP. Apart from an increase between the years 2011 and 2012 (from 49.1% of GDP to 49.7%), it has steadily decreased ever since, and remained stable at 46.7% of GDP between 2017 and 2018. This gradual decrease was partly the result of the fiscal consolidation measures, renewed economic growth and counter-cyclical reactions of government expenditure. In recent years, one-off expenditure to support financial institutions has been decreasing.
Not all the functions of government expenditure evolved the same between 2007 and 2018. Some of the functions have a natural tendency to be counter-cyclical, even without a change in policy. For example, government expenditure on unemployment benefits (part of social protection) is more prone to have a natural counter-cyclical evolution than other functions, such as government expenditure on education. During an economic crisis, more people become unemployed, whereas the number of pupils and students is more affected by demographic changes. Between 2007 and 2009, expenditure on unemployment in the EU increased from 1.5% of GDP to 1.9%, gradually decreasing to stand at 1.3% in 2018. Social protection expenditure as a whole increased from 17.6% of GDP (2007) to 19.8% (2009), standing at 19.2% of GDP in 2018. In the same period, government expenditure on education in the EU rose from 4.7% of GDP (2007) to 5.1% (2009), and then gradually decreased to 4.6% (2018).
Social protection and health expenditure increased in comparison to other general government expenditure
‘Social protection’ and ‘health’ are the only two functions whose shares in total government expenditure increased during the period from 2007 to 2018. In the EU, social protection expenditure increased its share in total expenditure from 38.7% to 41.2%, while expenditure on health increased from 14.3% to 15.0% of total expenditure. In contrast, government expenditure on ‘public services’, for example, fell from 15.0% of total expenditure in 2007 to 12.9% in 2018.
Over this period, government expenditure on ‘public order and safety’ and ‘environmental protection’ remained unchanged.
Geographical information
The European Union (EU27) includes Belgium, Bulgaria, Czechia, Denmark, Germany, Estonia, Ireland, Greece, Spain, France, Croatia, Italy, Cyprus, Latvia, Lithuania, Luxembourg, Hungary, Malta, the Netherlands, Austria, Poland, Portugal, Romania, Slovenia, Slovakia, Finland and Sweden.
The euro area consists of Belgium, Germany, Estonia, Ireland, Greece, Spain, France, Italy, Cyprus, Latvia, Lithuania, Luxembourg, Malta, the Netherlands, Austria, Portugal, Slovenia, Slovakia and Finland. The United Kingdom left the European Union on 31 January 2020. Information on dissemination of European statistics from 1 February 2020 is published on the Eurostat website.